I. Culum, J.B. Orange, D. Forbes, M. Borrie
Health and Rehabilitation Sciences (Health and Aging), Faculty of Health Sciences, Western University, London, ON, Canada
Corresponding Author: Ivan Culum, Health and Rehabilitation Sciences (Health and Aging), Faculty of Health Sciences, Western University, London, ON, Canada, E-mail: iculum@uwo.ca
Abstract
Introduction: The World Health Organization (WHO) recommends a diet that limits saturated fat consumption and encourages unsaturated fat consumption. A diet that is compatible with the WHO recommendations and of considerable interest to researchers interested in dementia is the Mediterranean diet (MeDi). What is known empirically at present about the MeDi and dementia is that t may have roles to play in reducing the risk factors as well as the overall risk for developing dementia. Objectives: In this cross-sectional study, we examined the macronutrient composition of the average Canadian diet (CanDi) in order to see how it may differ from the average Mediterranean diet (MeDi). Additionally, we compared how the CanDi differs between groups based on gender, age, geographical location and classification (i.e. urban vs. rural), and dementia risk. Design: The Canadian Community Health Survey (CCHS) 2.2 data were used to estimate the macronutrient composition of the CanDi for older adults (age 50+) (N = 10,503 [4,955 male, 5,548 female], mean age = 64[10.30]). Results: The average daily macronutrient intake in a CanDi was found to be 227.7 g of carbohydrates, 78.5 g of proteins, 67.8 g of fats (21.8 g of saturated fats, 27.1 g of monounsaturated fats, and 12.4 g of polyunsaturated fats), as well as 8.3 g of alcohol and have an average energy value of 1856.9 Kcal. The energy breakdown by macronutrient in a CanDi is estimated as follows: 49.2% from carbohydrates, 16.9% from proteins, and 31.1% from fats (10% saturated, 12.3% monounsaturated, and 5.7% polyunsaturated fats). On average, the respondents did not meet the daily energy requirements for their respective age group as outlined in Canada’s Food Guide. Conclusion: The macronutrient composition of the CanDi differs not only from the MeDi, but also from previous Western diet generalizations. Of particular interest is the finding that respondents identified as being “at-risk” for developing dementia consumed significantly less of each macronutrient and less food overall than those who were identified as otherwise healthy.
Key words: Diet, aging, dementia, Mediterranean diet.
Introduction
Global average life expectancy has increased steadily from the early 20th century from 46.5 years to 70 years (1). According to experts in the United Nations Population Division, this pattern will continue into the near future. There also will be an increasing worldwide proportion of individuals over 65 years of age with those aged 85+ being the fastest growing cohort of all (1). In concert with the increasing global prevalence of older adults is the rise of chronic diseases among older adults, such as dementia, which are the leading causes of mortality among those 65 years of age and older in Canada (2, 3).
Dementia is a syndrome in which there are persistent and progressive declines in memory, language and communication, personality, visuospatial skills and other cognitive processes such as executive functions (4). It is estimated that by 2038 approximately 1.1 million Canadians (2.8% of the overall population) will exhibit dementia (5). These estimates mean that the number of persons with dementia in Canada will more than double in just three decades (from approximately 480,000 in 2008 to approximately 1,125,000 in 2038) (5). The incidence of Alzheimer’s disease (AD), the most prevalent type of dementia, also is rising. There are 7.7 million new cases of dementia worldwide, which translates to approximately one new case every four minutes (6). It is estimated that AD will occur in 1 out of 85 persons worldwide by 2050 (7). The worldwide prevalence of AD was estimated to be 35.5 million in 2010 (8) with a quadrupling projected for 2050 (7). However, others have suggested that dementia incidence and prevalence has been on the decline in high-income European and North American nations (9, 10, 11]. While this is certainly a bit of good news, meaning that the aforementioned projections of absolute numbers of people with dementia may be a bit less dramatic, this does not mean that dementia will not remain a healthcare, economic, societal, emotional burden for years to come.
AD is the most prevalent type of dementia, followed by vascular dementia (VaD), Lewy-body dementia (LBD), and frontotemporal dementia (FTD) (6). AD and VaD account for most of the dementia cases worldwide. “Pure” AD and “pure” VaD occur less frequently than previously thought. It is common to find pathology relating to more than one dementia type in the brains of persons with dementia (PWD). The combination of pathologies of AD and VaD is called mixed dementia (MD) though no standard diagnostic tools exist for this type of pathology (12).
To compound the rising global prevalence of dementia and the monumental care needs for those with dementia are the staggering costs of current care which are significant and increasing sharply. Estimates in 2010 for the total worldwide societal costs for dementia were USD 604 billion (6, 8), up from 315 billion in 2005 (13). Estimates based on data from the Canadian Study on Health and Aging (CSHA) reveal that annual societal costs of caring for older adults with dementia in Canada range from approximately CAD 10,000 for mild cases to CAD 38,000 for severe cases (14). Over 80% of these costs are attributed to institutionalization (15). Overall, Canadian dementia economic burden was estimated to be approximately CAD 15 billion in 2008 and is projected to increase to approximately CAD 870 billion by 2038 (5). Researchers estimated the annual cost of caring for a person with VaD to be USD 14,000 (16). Statistics Canada estimated the annual Canadian household per capita income to be CAD 42,600 (17) reinforcing further the severity and the importance of the economic impact of dementia on caregivers and to Canadian society in general. The financial burden to Canadians because of dementia, in all its forms, now and in the coming future simply cannot be ignored.
Diet and Aging
Preventive approaches designed to limit the development of chronic illnesses, such as dementia, are becoming increasingly important to researchers, clinicians, policy makers and caregivers. The preventive approaches, such as diet modifications, are most effective well before a disease manifests (primary prevention) but can be useful even after the disease emerges (secondary prevention). Prevention also can be cost-effective. While a healthy diet versus an unhealthy diet is more expensive in an immediate sense, societal and personal economic savings can be realized based on delaying disease onset. Adhering to a healthy diet can compress morbidity, that is, the overall reduction of end-of-life disease length (18). Therefore, reducing the incidence and prevalence of chronic diseases through dietary changes may improve the efficiency of health-care systems, and enhance the quality of life for those with chronic illnesses and for their caregivers.
Healthy eating is a key component in healthy aging. Charlton (2002) demonstrates that the adoption of a healthy diet can increase overall life expectancy and can contribute to better overall health (19). While adopting a healthier diet is most effective earlier in life, it is important to note that protective benefits of a healthier diet can occur at any age (20). Unhealthy dietary habits (e.g., increased saturated fat intake) can lead to obesity that increases an individual’s chances of developing a variety of negative health outcomes such as cardiovascular disease, hypertension, hyperlipidemia, and diabetes. These conditions increase the risk of dementia in older adults and are identified as risk factors (21, 22). Minimizing these risk factors should be a key component in healthy aging.
A person’s metabolism slows down with advancing age where less energy is required to maintain normal functions. The adoption of healthier eating habits, particularly in response to age-related metabolic needs, can reduce directly the risk factors for vascular disease, which in turn can help reduce the development of dementia in most forms (e.g., AD, VaD and mixed). Findings from several longitudinal studies showed that healthier eating can result in reduced cholesterol levels (23-25) and systolic blood pressure (24). While there is no single healthy diet, the WHO recommends a diet that is limited in saturated fat consumption versus one in which there is unsaturated fat consumption. The WHO recommends that a healthy diet also includes: limiting overall energy intake from all fat sources, increasing the overall consumption of fruits and vegetables, legumes, and nuts/grains, and decreasing the intake of sodium and free sugars (26). A diet that is compatible with the WHO recommendations and of considerable interest to researchers interested in dementia is the Mediterranean diet (MeDi).
The Mediterranean Diet
The MeDi, which varies slightly among Mediterranean regions, commonly includes components such as high consumption of fish, fruits/vegetables/legumes, and grains, coupled with moderate dairy and alcohol consumption, and low meat consumption (27). Researches from Greece estimated that the average daily macronutrient intake in a MeDi consists of 255.0 g of carbohydrates, 74.5 g of proteins, 110.7 g of fats (29.8 g of saturated fats, 63.8 g of monounsaturated fats, and 9.9 g of polyunsaturated fats), as well as 14 g of alcohol, and have an average energy value of 2473 Kcal (28). Furthermore, the energy breakdown by macronutrient in a “typical” MeDi is estimated as follows: 47% from carbohydrates, 15% from proteins, and 38% from fats (10% saturated, 22% monounsaturated, and 6% polyunsaturated fats) (29). In comparison, the “typical” Western diet provides 42% of daily energy from carbohydrates, 20% from proteins, and 38% from fats (17% saturated, 14% monounsaturated, and 7% polyunsaturated fats) (30).
Since the 1960s the MeDi has received increasing scientific attention because of its association with a reduced risk of hypertension (31), coronary heart disease (32), obesity (33), as well as overall mortality (34). Researchers suggest that the MeDi may be beneficial in reducing the risk of AD and related dementias regardless of vascular comorbidity (35). Others suggest that the antioxidants typically found in olive oil compounds and red wine, components common in the MeDi, mediate vascular pathology (36, 37). Additionally, polyunsaturated fatty acids (PUFAs) (specifically omega-3 fatty acids) also may play an important role in mediating inflammatory response thereby further reducing the risk of vascular pathology (12, 38). It is likely that the MeDi is more than just a sum of its components and that its benefits are a result of multiple components working in tandem, although definitive evidence remains needed.
There is a growing body of evidence in favour of adopting the MeDi to help optimize health status and to reduce the risk of dementia. In a recent meta-analysis of studies in which a MeDi intervention was used, researchers reported that a higher adherence to the MeDi was associated with better cognitive function (and lower rate of cognitive decline), as well as an overall reduction of AD risk (39). In an earlier meta-analysis, researchers reported that an increase in MeDi adherence translated to a 10% reduction in death and/or incidence of vascular diseases as well as a 13% reduction of the incidence of neurodegenerative diseases (40). There also is evidence that adopting the MeDi reduces the risk of mild cognitive impairment (MCI) and the conversion of MCI to dementia (41). It is important to note that while MeDi research interest has been increasing over the past decade the relationship between MeDi and dementia risk remains a rising area of research activity.
Statement of Problem
What is known empirically at present about the MeDi and dementia is that it may have roles to play in reducing the risk factors as well as the overall risk for developing dementia. However, what remains unknown is how the average Canadian diet (CanDi) differs from the average Mediterranean diet (MeDi) and the implications of such differences on the development of dementia among Canadians. While previous research has focused primarily on the health benefits of either living in the Mediterranean region or the adoption of the MeDi in different regions worldwide, no investigators have published studies that examined how dietary habits of older Canadians compare to the MeDi. This is a necessary first step toward a clearer understanding of how much effort may be necessary to promote a shift toward the MeDi among Canadian older adults, particularly for those with dementia, those who are at-risk for developing dementia, or those who are otherwise healthy.
The aim of this retrospective study was to fill this knowledge gap concerning the dietary habits of Canadian older adults. The following research questions were posed.
Research Questions
1. What is the macronutrient composition of the typical diet of Canadian older adults (50+ years) according to the CCHS Cycle 2.2 (2004) data set?
2. Are there differences in dietary patterns between different Canadian older adult participant groups?
a. Is there a difference in dietary patterns between:
i. the young-old (51 to 70) vs. the older adult (71+) cohorts
ii. men vs. women in each of the two cohort age groups?
3. Are there differences in dietary patterns relative to geographical location (i.e., province and rural/urban areas) in Canada?
4. Are there differences in dietary patterns between “at-risk” (cognitively intact, but with vascular risk factors such as metabolic syndrome) and “healthy” groups?
Method
Study Design
Nutritional data were mined from the Canadian Community Health Study Cycle 2.2 (42) for this between groups retrospective study. These data represent the most current and comprehensive profile of dietary habit of Canadians. Permission from and authorization to access the restricted Statistics Canada database was obtained from the Research Data Centre (RDC) through a proposal submitted to the Social Sciences and Humanities Research Council of Canada (SSHRC) by the first author (IC).
Participants
Participant responses were obtained from the existing CCHS 2.2 data set (2004) (N = 10,524). The CCHS 2.2 employed a multistage stratified cluster design that provided a sample representative of the general Canadian population in terms of age, gender, geographical location, as well as socioeconomic status (42). The computer-assisted interviews were conducted from January 14, 2004 to January 21, 2005, with a random subset of Canadian participants selected for a second interview (24-hour dietary recall). All initial interviews were conducted in respondents’ homes, with the majority of the follow-up interviews conducted over telephone (others were conducted in-person). For the purpose of this study, respondents were placed into one of two groups based on their age at the time of their interview (51 to 70 inclusive or over 70) in order to correspond with the top two age bands as outlined in the Estimated Energy Requirements section of Canada’s Food Guide (43).
Materials and Measures
The respondents’ dietary habits were assessed via a computer-aided-interview as well as a 24-hour dietary recall in the CCHH 2.2. These data were used to determine the macronutrient composition of the CanDi for older adult Canadians.
Ethics and Permissions
Permission to use CCHS 2.2 data was obtained from Statistics Canada through the local Research Data Centre (RDC) at Western University. The statistical analyses were vetted by the Senior Analyst at the RDC to ensure that no participant could be identified due to sub-group analysis. In accordance with RDC regulations, no raw data were removed from the RDC office.
Data Collection
Relevant data from the CCHS 2.2 were mined at the Western University RDC and exploratory data analyses were performed. The dataset was selected because it is the most current, large survey of its kind in Canada that contains relevant dietary information. Variables of interest were age (categorized), gender, province, geographical classification (urban or rural), daily macronutrient intakes (in grams), alcohol intake (in grams), energy from all food sources (in kilocalories), percentage of energy from specific macronutrients, and dementia risk status (healthy or at-risk). The only inclusion criteria for the sample selection was age (over 50) and not missing any responses pertaining to the abovementioned variables of interest. Respondents with incomplete or missing variables of interest were not considered for this study. The macronutrient variables include carbohydrates, proteins, fats, saturated fats (SFs), monounsaturated fatty acids (MUFAs), and polyunsaturated fatty acids (PUFAs). SFs, MUFAs, and PUFAs are a subset of fats and these values are not added to the overall daily fat intake. Furthermore, there are other types of fats not accounted for by this breakdown and the total daily fat intake value, therefore, is greater than the sum of these three types. The study variables were derived from questionnaire and interview responses and are only an estimate of the macronutrient composition of the respondents’ diets. The variables were selected because they are the best available method of quantifying the CanDi given the available data.
Data Analyses
The CCHS 2.2 data were used to estimate the macronutrient composition of the CanDi. The normality of the sample was tested using the Kolmogorov–Smirnov and test (and the Shapiro–Wilk test in one case where a sub-group size was too small for the former test). With the exception of one small sub-group (respondents from Prince Edward Island), the responses were not distributed normally. Non-parametric tests were conducted on the data. IBM SPSS Statistics 22.0 for Microsoft Windows® (IBM Corp., Armonk, USA) was used to perform the exploratory data analysis, as well as independent samples Mann-Whitney U and Kruskal-Wallis tests (corrected for tied ranks).
Results
The inclusion criteria identified 10,524 relevant respondents. Due to missing data, 21 respondents were not used in the analyses (N = 10,503). The younger cohort (51 to 70) included 7,570 respondents (3,712 men, 3,858 women) while the older cohort (>70) included 2,933 respondents (1,243 men, 1,690 women). The mean age is 58.9 years for the younger cohort and 78.2 years for the older cohort.
The macronutrient composition of the CanDi for the respondents is presented in Table 1. The male respondents reported consuming significantly more carbohydrates, proteins, fats, SFs, MUFAs, PUFAs, and alcohol by weight (g) vs. the female respondents. Men also had a significantly higher daily caloric intake than women. Carbohydrates were the largest source of energy for both genders, followed by fats, with proteins being responsible for the least amount of energy from food sources (Table 2). Younger respondents consumed significantly more carbohydrates, proteins, fats, SFs, MUFAs, PUFAs, and alcohol by weight (g) than older respondents (Table 1). Younger respondents also had a significantly higher daily caloric intake than older respondents. Carbohydrates were the largest source of energy for both cohorts (Table 2) as well as by gender within cohorts (Table 4), followed by fats, with proteins being responsible for the least amount of energy from food sources (Tables 2 and 4).
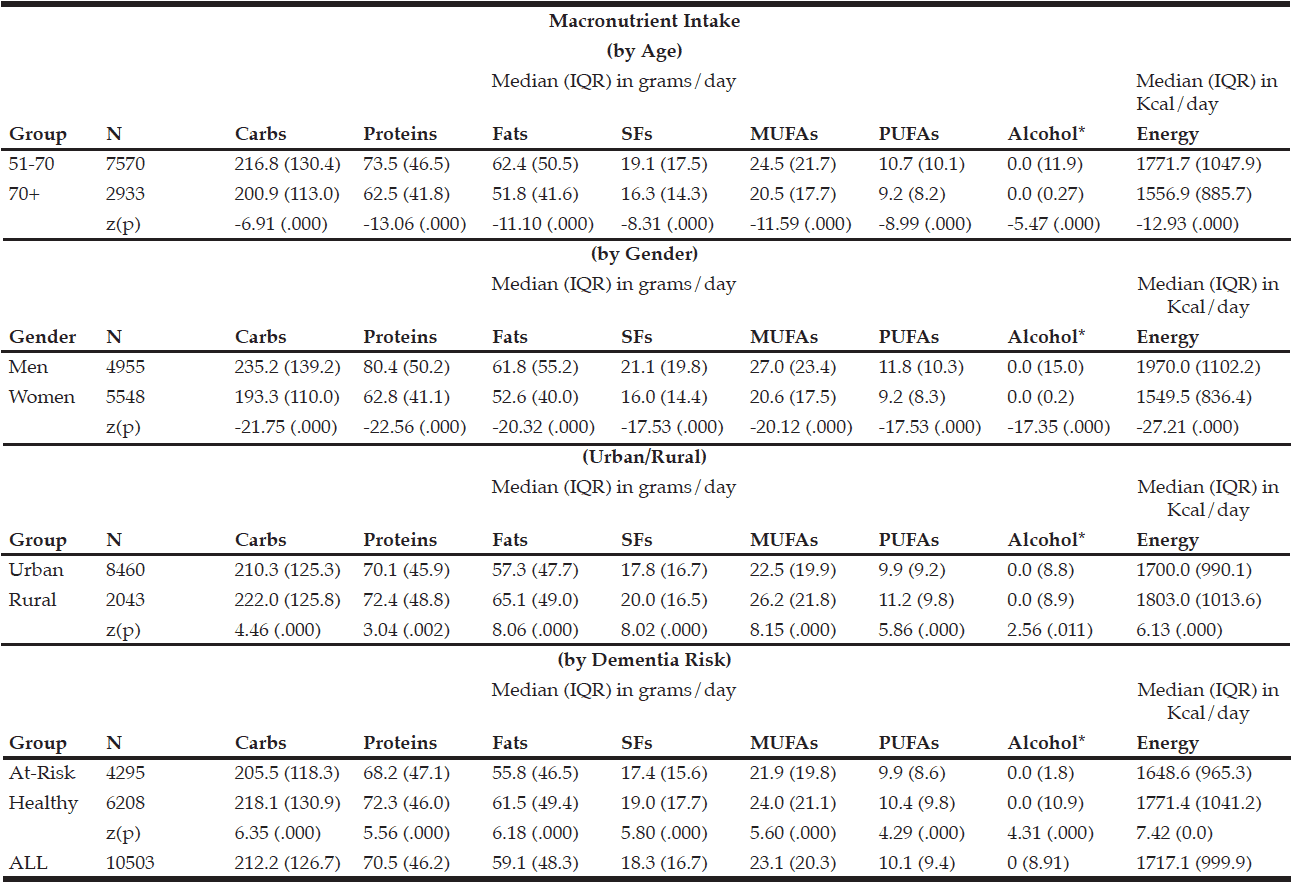
Table 1 Macronutrient intake (in grams) by age group, gender, geographical classification and dementia risk
* Median value is near zero due to many respondents’ non-consumption of alcohol on a daily basis
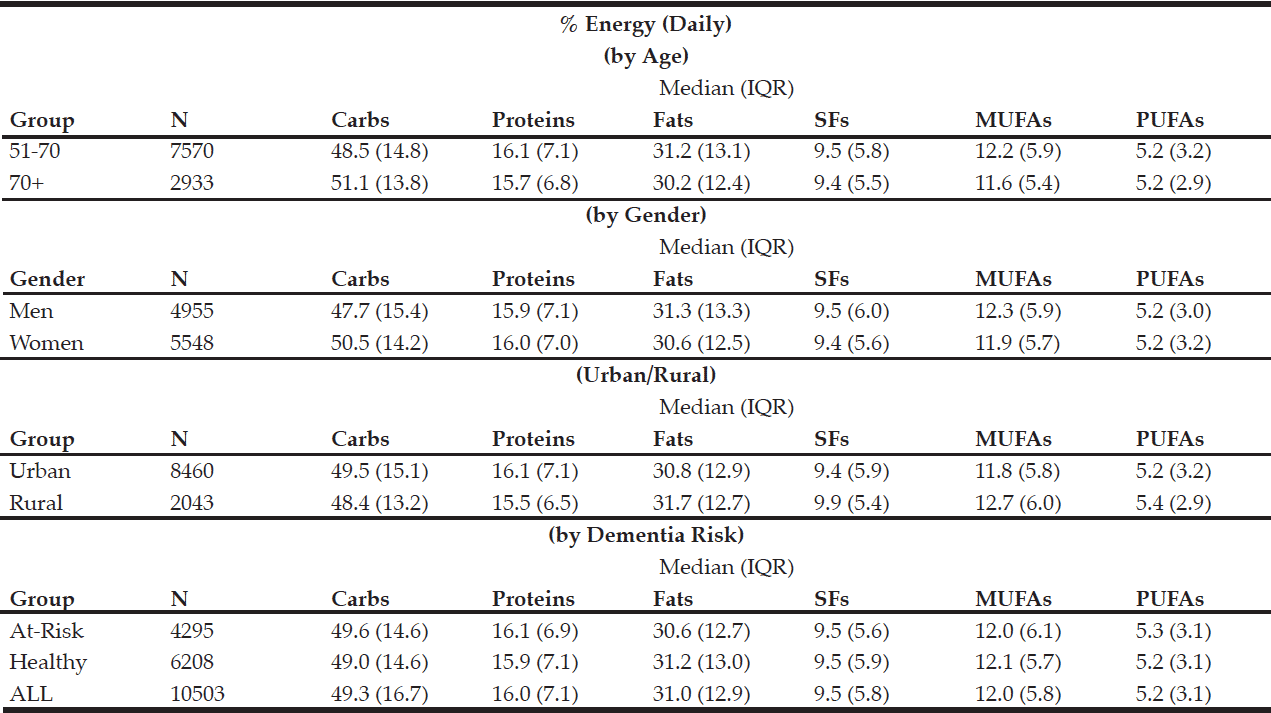
Table 2 Percentage of daily energy by source (by age group, gender, geographical classification and dementia risk)
Within the younger respondent group, men consumed significantly more carbohydrates, proteins, fats, SFs, MUFAs, PUFAs, and alcohol by weight (g) vs. women (Table 3). Men also had a significantly higher daily caloric intake than women. Carbohydrates were the largest source of energy for both genders, followed by fats, with proteins being responsible for the least amount of energy from food sources (Table 4). Within the older respondent group, men again consumed significantly more carbohydrates, proteins, fats, SFs, MUFAs, PUFAs, and alcohol by weight (g) vs. women (Table 3). Men in the older cohort also had a significantly higher daily caloric intake vs. women in the older cohort. Carbohydrates were the largest source of energy for both genders, followed by fats (Table 4), with proteins being responsible for the least amount of energy from food sources.
* Median value is near zero due to many respondents’ non-consumption of alcohol on a daily basis
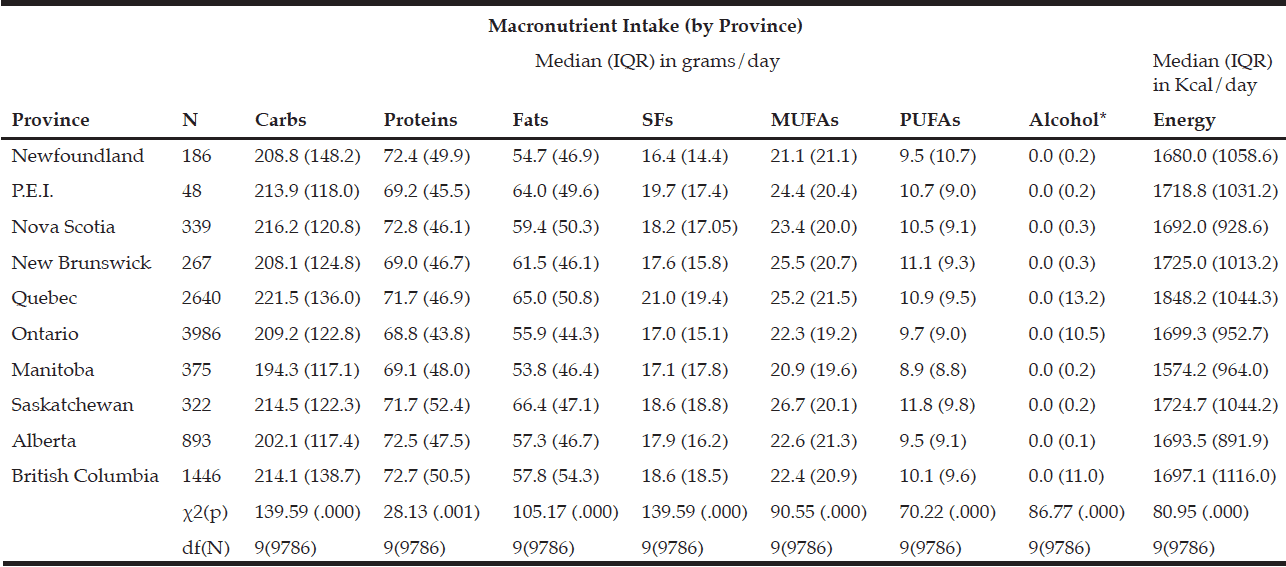
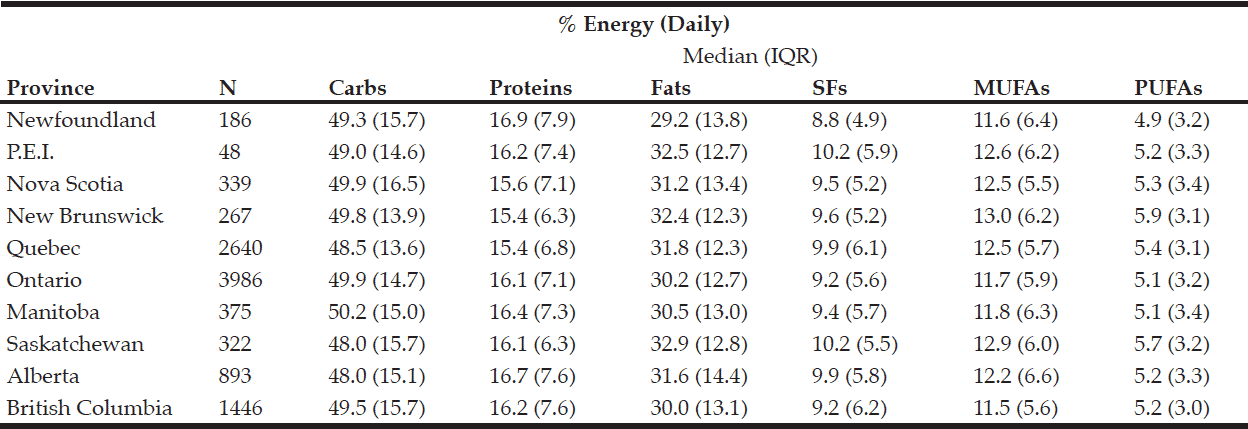
Rural respondents consumed significantly more carbohydrates, proteins, fats, SFs, MUFAs, PUFAs, and alcohol by weight (g) vs. urban respondents (Table 1). Rural respondents also had a significantly higher daily caloric intake vs. their urban counterparts. Among provinces, there were statistically significant differences in daily carbohydrate, protein, fat, SF, MUFA, PUFA, and alcohol intakes by weight (g) (Table 5). Carbohydrates were the largest source of energy regardless of geographical classification (Table 2) or province (Table 6), followed by fats, with proteins being responsible for the least amount of energy from food sources.
* Median value is near zero due to many respondents’ non-consumption of alcohol on a daily basis
Respondents who were identified to be at-risk for developing dementia (i.e., diagnosed with diabetes and/or hypertension and/or hypercholesterolemia) consumed significantly fewer carbohydrates, proteins, fats, SFs, MUFAs, PUFAs, and alcohol by weight (g) vs. those who were otherwise healthy (Table 1). These respondents also had a significantly lower daily caloric intake vs. those who are otherwise healthy. Carbohydrates functioned as the largest source of energy regardless of dementia risk status (Table 2), followed by fats, with proteins being responsible for the least amount of energy from food sources. There was an estimated 3,638,971 individuals over the age 50 in Canada who are at-risk for developing dementia (1,489,170 over the age of 70) out of an estimated 8,897,946 Canadians over the age of 50. This represents approximately 41% of all individuals over the age of 50 and 60% of all individuals over the age of 70.
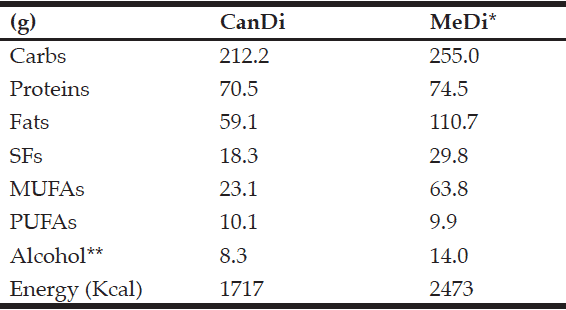
* From Trichopoulou et al. (2006)
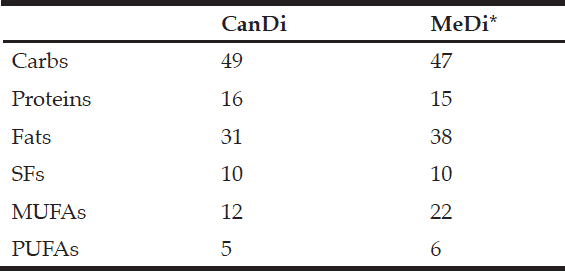
* From Sacks & Katan (2002)
Discussion
The aim of this study was to estimate the dietary habits of Canadian older adults by examining the macronutrient composition of the CanDi using the most current Canada-wide survey data. Results show a median daily intake of 212.2 g of carbohydrates, 70.5 g of proteins, and 59.1 g of fats (including 18.3 g of SFs, 23.1 g of MUFAs, and 10.1 g of PUFAs). These values translate into 49.3% of daily energy from carbohydrates, 16.0% from proteins, and 31.0% from fats. The CanDi estimate differs from the MeDi estimate based on a lower daily carbohydrate intake (-42.8 g), slightly lower protein intake (-4.0 g), and a much lower total fat intake (-51.6 g). When comparing specific fat types, the CanDi is characterized by a lower daily SF intake (-11.5 g), much lower MUFA intake (-40.7 g), and a slightly higher PUFA intake (+0.2 g). The CanDi also can be characterized by a lower daily alcohol consumption (5.7 g less than in the MeDi estimate). It is important to note that many respondents did not report that they consume any alcoholic beverages on a regular basis. When comparing mean daily energy values, the CanDi provides ~756 Kcal less energy than the MeDi (Table 7).
The CanDi, based on the Canadian Community Health Study Cycle 2.2 data used in this study, is estimated to provide 2% more energy from carbs and 1% more energy from proteins than the MeDi. The CanDi provides 7% less energy from fats. Particularly notable is the comparison between energy intake by fat types, where both the CanDi and the MeDi provide 10% of daily energy from SFs (Table 8). The CanDi varies significantly among the various comparison sub-groups (age group, gender, geographical classification, province, and dementia risk status). However, it is important to note that neither age group meets the daily energy requirements for their respective group as outlined in Canada’s Food Guide (43) for even the most sedentary lifestyle, let alone an active one. The difference in daily energy requirements is even greater when comparing group medians to the recommended guideline values. However, this is not sufficient cause for alarm due to respondents’ tendency to underestimate their overall food intake (44). The higher daily energy intake values among men vs. women also are not surprising due to their relatively larger body size, but the difference becomes smaller between genders in the older age group (though no less significant). Differences among macronutrient intakes by province are also not surprising, possibly due to Canada’s varied geography, different cultural and ethnic backgrounds, and the sheer size of the country. Further analysis should involve a comparison based on likeness of region rather than provincial borders and should include the northern territories as well (though no territorial data is available in the CCHS 2.2 and this should be kept in mind when collecting new data). While the “healthy” sub-group consumes more of each macronutrient (even the SFs), it is unlikely that their “at-risk” counterparts owe their status to a lower overall food and energy intake. It is possible that these respondents are less active and may in fact still be consuming more relative to their counterparts. This is, however, the most important finding of our study relative to dementia as it suggests that the link between diet and dementia risk merits further exploration, which has also been suggested in recent meta-analyses (45, 46). Further investigation is necessary, particularly since there is a limited availability of pharmacological treatment options for cognitive impairment and dementia (47).
Furthermore, it is important to note that the CCHS 2.2 nutritional data is based on a single 24-hour dietary recall, with a smaller sample being invited for a follow-up interview. As such, we advise that these results be interpreted with caution, as multiple recalls are recommended in order to accurately depict an individual’s nutrient intake (48).
Limitations
A limitation of this study is the age of the data. Due to increasing globalization additional foods are making their way into Canadians’ diet and this may result in significant changes of the CanDi composition. Unfortunately, no newer data exist at this time. The Canadian Federal government has not undertaken more recent national surveys of the dietary habits of Canadians. In addition, comparing PUFA intakes in this study is problematic because the CCHS 2.2 data does not provide a ratio of omega-6 to omega-3 PUFAs, though this is an inherent limitation of previous Western diet estimates as well. Bearing in mind the variance in data collection methods and sample sizes, these comparisons should be interpreted with caution and further exploration of the topic is necessary. It also is important to remember that these are only estimates of CanDi composition that are derived from responses to a questionnaire and an interview (which as noted above is another limitation in itself). Finally, the required daily energy estimates are based on a dated food guide.
Conclusion
Based on the available data set, the average Canadian (over the age of 50) has a mean daily intake of 212.2 g of carbohydrates, 70.5 g of proteins, and 59.1 g of fats. This includes 18.3 g of SFs, 23.1 g of MUFAs, and 10.1 g of PUFAs. This represents a 49.3% of daily energy intake from carbohydrates, 16.0% from proteins, and 31.0 from% fats. The macronutrient composition of the CanDi differs not only from the MeDi, but also from previous Western diet generalizations (49). This is not entirely unexpected. There are regional variations of the MeDi and such should be expected in the Western diet as well. Of particular interest is the finding that respondents identified as being “at-risk” for developing dementia consumed significantly less of each macronutrient and less food overall than those who were identified as otherwise healthy. Newer and richer data are needed in order to make a more accurate estimate of the current CanDi. Further research should be focused on physical activity levels in tandem with food intake, as well as taking cognitive impairment (and being at-risk for such impairment) into account in in the design phase of the study.
Conflict of Interest: None.
References
1. World population prospects: The 2012 revision [Internet].; 2012. Available from: http://esa.un.org.proxy1.lib.uwo.ca/wpp/documentation/pdf/wpp2012_highlights.pdf.
2. Percentage distribution for the 5 leading causes of death in Canada, 2011 [Internet].; 2014. Available from: http://www.statcan.gc.ca.proxy1.lib.uwo.ca/pub/82-625-x/2014001/article/11896/c-g/c-g01-eng.htm.
3. Wilkins, K. Predictions of death in seniors [Internet].; 2006. Available from: http://www.statcan.gc.ca.proxy1.lib.uwo.ca/pub/82-003-s/2005000/pdf/9090-eng.pdf.
4. McKhann GM, Knopman DS, Chertkow H, Hyman BT, Jack CR,Jr, Kawas CH, et al. The diagnosis of dementia due to Alzheimer’s disease: Recommendations from the national institute on aging-Alzheimer’s association workgroups on diagnostic guidelines for Alzheimer’s disease. Alzheimer’s & Dementia. 2011 May;7(3):263-9.
5. Rising tide: The impact of dementia on Canadian society [Internet].; 2010. Available from: http://www.alzheimer.ca/~/media/Files/national/Advocacy/ASC_Rising%20Tide_Full%20Report_Eng.ashx.
6. Dementia – A public health priority [Internet].; 2012. Available from: http://whqlibdoc.who.int.proxy1.lib.uwo.ca/publications/2012/9789241564458_eng.pdf.
7. Brookmeyer R, Johnson E, Ziegler-Graham K, Arrighi HM. Forecasting the global burden of alzheimer’s disease. Alzheimer’s & Dementia. 2007 Jul;3(3):186-91.
8. World Alzheimer report 2010: The global impact of dementia [Internet].; 2010. Available from: http://www.alz.co.uk/research/files/WorldAlzheimerReport2010.pdf.
9. Schrijvers EM, Verhaaren BF, Koudstaal PJ, Hofman A, Ikram MA, Breteler MM. Is dementia incidence declining?: Trends in dementia incidence since 1990 in the Rotterdam study. Neurology. 2012 May 8;78(19):1456-63.
10. Langa KM, Larson EB, Karlawish JH, Cutler DM, Kabeto MU, Kim SY, et al. Trends in the prevalence and mortality of cognitive impairment in the united states: Is there evidence of a compression of cognitive morbidity?. Alzheimer’s & Dementia. 2008 Mar;4(2):134-44.
11. Manton KC, Gu XL, Ukraintseva SV. Declining prevalence of dementia in the U.S. elderly population. Advances in Gerontology = Uspekhi Gerontologii/Rossiiskaia Akademiia Nauk, Gerontologicheskoe Obshchestvo. 2005;16:30-7.
12. Culum I, Orange JB, Forbes D, Borrie M. Omega-3 polyunsaturated fatty acids and dementia. 27th international conference of Alzheimer’s disease international; London, UK. ; 2012.
13. Wimo A, Winblad B, Jonsson L. An estimate of the total worldwide societal costs of dementia in 2005. Alzheimer’s & Dementia. 2007 Apr;3(2):81-91.
14. Canadian Study on Health and Aging Working Group. Canadian study of health and aging: Study methods and prevalence of dementia. CMAJ Canadian Medical Association Journal. 1994 Mar 15;150(6):899-913.
15. Hux MJ, O’Brien BJ, Iskedjian M, Goeree R, Gagnon M, Gauthier S. Relation between severity of Alzheimer’s disease and costs of caring. CMAJ Canadian Medical Association Journal. 1998 Sep 8;159(5):457-65.
16. Hill J, Fillit H, Shah SN, del Valle MC, Futterman R. Patterns of healthcare utilization and costs for vascular dementia in a community-dwelling population. J Alzheimer’s Dis. 2005 Sep;8(1):43-50.
17. Changes in family wealth [Internet].; 2008. Available from: http://www.statcan.gc.ca.proxy1.lib.uwo.ca/pub/75-001-x/2008106/pdf/10640-eng.pdf.
18. Fries JF. Aging, natural death, and the compression of morbidity. N Engl J Med. 1980 Jul 17;303(3):130-5.
19. Charlton KE. Eating well: Ageing gracefully! Asia Pac J Clin Nutr. 2002;11(Suppl 3):S607-17.
20. Chernoff R. Nutrition and health promotion in older adults. Journals of Gerontology Series A-Biological Sciences & Medical Sciences. 2001 Oct;56(Spec 2):47-53.
21. Middleton LE, Yaffe K. Promising strategies for the prevention of dementia. Arch Neurol. 2009 October;66(10):1210-5.
22. Whitmer RA, Sidney S, Selby J, Johnston SC, Yaffe K. Midlife cardiovascular risk factors and risk of dementia in late life. Neurology. 2005 January 25;64(2):277-81.
23. Dayton S, Pearce ML, Goldman H, Harnish A, Plotkin D, Shickman M, et al. Controlled trial of a diet high in unsaturated fat for prevention of atherosclerotic complications. Lancet. 1968 Nov 16;2(7577):1060-2.
24. Jacobs DR,Jr, Luepker RV, Mittelmark MB, Folsom AR, Pirie PL, Mascioli SR, et al. Community-wide prevention strategies: Evaluation design of the minnesota heart health program. J Chronic Dis. 1986;39(10):775-88.
25. van Beurden EK, James R, Henrikson D, Tyler C, Christian J. The north coast cholesterol check campaign. results of the first three years of a large-scale public screening programme. Med J Aust. 1991 Mar 18;154(6):385-91.
26. Global strategy on diet, physical activity and health [Internet].; 2004. Available from: http://www.who.int.proxy1.lib.uwo.ca/dietphysicalactivity/strategy/eb11344/strategy_english_web.pdf.
27. Trichopoulou A, Lagiou P. Healthy traditional Mediterranean diet: An expression of culture, history, and lifestyle. Nutr Rev. 1997 Nov;55(11 Pt 1):383-9.
28. Trichopoulou A, Vasilopoulou E, Georga K, Soukara S, Dilis V. Traditional foods: Why and how to sustain them. Trends Food Sci Technol. 2006;17(9):498-504.
29. Fernandez de la Puebla RA, Fuentes F, Perez-Martinez P, Sanchez E, Paniagua JA, Lopez-Miranda J, et al. A reduction in dietary saturated fat decreases body fat content in overweight, hypercholesterolemic males. Nutrition Metabolism & Cardiovascular Diseases. 2003 Oct;13(5):273-7.
30. Sacks FM, Katan M. Randomized clinical trials on the effects of dietary fat and carbohydrate on plasma lipoproteins and cardiovascular disease. Am J Med. 2002;113(9):13-24.
31. Chrysohoou C, Panagiotakos DB, Pitsavos C, Das UN, Stefanadis C. Adherence to the Mediterranean diet attenuates inflammation and coagulation process in healthy adults: The ATTICA study. J Am Coll Cardiol. 2004 Jul 7;44(1):152-8.
32. Singh RB, Dubnov G, Niaz MA, Ghosh S, Singh R, Rastogi SS, et al. Effect of an Indo-Mediterranean diet on progression of coronary artery disease in high risk patients (Indo-Mediterranean diet heart study): A randomised single-blind trial. Lancet. 2002 Nov 9;360(9344):1455-61.
33. Schroder H, Marrugat J, Vila J, Covas MI, Elosua R. Adherence to the traditional Mediterranean diet is inversely associated with body mass index and obesity in a Spanish population. J Nutr. 2004 Dec;134(12):3355-61.
34. Knoops KT, de Groot LC, Kromhout D, Perrin AE, Moreiras-Varela O, Menotti A, et al. Mediterranean diet, lifestyle factors, and 10-year mortality in elderly European men and women: The HALE project. JAMA. 2004 Sep 22;292(12):1433-9.
35. Scarmeas N, Stern Y, Tang MX, Mayeux R, Luchsinger JA. Mediterranean diet and risk for Alzheimer’s disease. Ann Neurol. 2006 Jun;59(6):912-21.
36. Carluccio MA, Siculella L, Ancora MA, Massaro M, Scoditti E, Storelli C, et al. Olive oil and red wine antioxidant polyphenols inhibit endothelial activation: Antiatherogenic properties of Mediterranean diet phytochemicals. Arteriosclerosis, Thrombosis & Vascular Biology. 2003 Apr 1;23(4):622-9.
37. Chiva-Blanch G, Urpi-Sarda M, Llorach R, Rotches-Ribalta M, Guillen M, Casas R, et al. Differential effects of polyphenols and alcohol of red wine on the expression of adhesion molecules and inflammatory cytokines related to atherosclerosis: A randomized clinical trial. Am J Clin Nutr. 2012 Feb;95(2):326-34.
38. Helton WS, Espat NJ. Defining mechanisms of ω-3 fatty-acid activity. Nutrition. 2001;17(7-8):674-.
39. Lourida I, Soni M, Thompson-Coon J, Purandare N, Lang IA, Ukoumunne OC, et al. Mediterranean diet, cognitive function, and dementia: A systematic review. Epidemiology. 2013 Jul;24(4):479-89.
40. Sofi F, Abbate R, Gensini GF, Casini A. Accruing evidence on benefits of adherence to the Mediterranean diet on health: An updated systematic review and meta-analysis. Am J Clin Nutr. 2010 Nov;92(5):1189-96.
41. Scarmeas N, Stern Y, Mayeux R, Manly JJ, Schupf N, Luchsinger JA. Mediterranean diet and mild cognitive impairment. Arch Neurol. 2009 Feb;66(2):216-25.
42. Canadian community health survey, cycle 2.2 [Internet].; 2004. Available from: http://www.hc-sc.gc.ca.proxy1.lib.uwo.ca/fn-an/surveill/nutrition/commun/cchs_focus-volet_escc-eng.php.
43. Canada’s food guide: Estimated energy requirements [Internet].; 2014. Available from: http://www.hc-sc.gc.ca.proxy1.lib.uwo.ca/fn-an/food-guide-aliment/basics-base/1_1_1-eng.php.
44. Mertz W, ed. Beltsville one-year dietary intake study. J Nutrition. 1984 Dec;6(suppl):1323-403.
45. Singh B, Parsaik AK, Mielke MM, Erwin PJ, Knopman DS, Petersen RC, Roberts RO. Association of Mediterranean diet with mild cognitive impairment and Alzheimer’s disease: a systematic review and meta-analysis. J Alzheimers Disease. 2014; 39(2):271-82.
46. Cooper C, Sommerlad A, Lyketsos CG, Livingston G. Modifiable predictors of dementia in mild cognitive impairment: a systematic review and meta-analysis. Am J Psych. 2015 Apr;172(4):323-34.
47. Psaltopoulou T, Sergentanis TN, Panagiotakos DB, et al. Mediterranean diet and stroke, cognitive impairment, depression: a meta-analysis. Ann Neurol. 2013 Sep; 74:580–591.
48. Basiotis PP, et al. Number of days of food intake records required to estimate individual and group nutrient intakes with defined confidence. J Nutrition. 1987 Sep;117(9):1638-41.
49. Pineo CE, Anderson JJB. Cardiovascular benefits of the Mediterranean diet. Nutrition Today. 2008;43:114-20.


